How to Forecast Business Costs: The Power of Cost Behavior Analysis

Understanding how costs behave is crucial for anyone involved in business management. Whether you’re planning a budget or making critical financial decisions, having a clear understanding of cost behavior can make all the difference. Let’s delve into the basics of cost behavior analysis.
What is Cost Behavior Analysis?
Cost behavior analysis refers to the study of how certain cost
s change in relation to different levels of business activity. In simpler terms, it’s about understanding whether costs go up or down or stay the same when business activity changes.
Types of Costs in Cost Behavior Analysis
There are four primary types of costs when discussing cost behavior:
- Fixed Costs: These are costs that do not change, regardless of how much or how little a business produces. Think of fixed costs as the monthly rent for a store. Whether the store sells 10 items or 1,000 items, the rent remains the same.
- Variable Costs: These costs change directly with the level of production. For instance, the cost of raw materials for a product will increase as more products are made.
- Mixed Costs (or Semi-variable Costs): These have elements of both fixed and variable costs. For example, a phone bill might have a fixed monthly charge plus additional charges based on usage.
- Step Costs: a step cost is an expense that remains fixed over a certain range of activity but then jumps to a higher level once that range is exceeded.
Why is Cost Behavior Analysis Important?
- Budgeting: By understanding cost behaviors, businesses can predict future costs and prepare accurate budgets.
- Decision-making: Knowledge of cost behavior helps managers make informed decisions about pricing, production levels, and more.
- Profit Analysis: Knowing how costs change with sales levels allows businesses to forecast profits more accurately.
Steps in Cost Behavior Analysis:
- Identify the Relevant Range: The relevant range is the range of activity where a company expects to operate. Costs may behave differently outside this range, so it’s essential to identify it first.
- Categorize Costs: For each cost, determine if it’s fixed, variable, mixed, or step.
- Analyze Mixed Costs: If a cost is mixed, further analysis might be required to break it down into its fixed and variable components. Various methods, like the high-low method or scatter plot analysis, can be used for this.
- Use the Data: With a clearer understanding of costs, businesses can make informed predictions about future costs based on expected levels of activity.
Cost behavior analysis is not just about categorizing costs. It’s a powerful tool that, when used effectively, can guide businesses to financial success. By understanding how costs behave, businesses can anticipate future expenses, set appropriate pricing strategies, and confidently make other critical financial decisions. For anyone involved in business management, gaining a firm grasp on cost behavior analysis is indispensable.
A Closer Look at Types of Costs in Cost Behavior Analysis
Many different costs arise in business. Each type of cost has its own set of characteristics and ways it responds to changes in business activity. Let’s delve deeper into the four types of costs in cost behavior analysis to provide a clearer picture.
Fixed Costs
Definition: Fixed costs do not change based on how much a business produces or sells.
Examples: Monthly store rent, permanent staff salaries, or insurance premiums. These costs remain unchanged regardless of how much a store sells or how many products a factory produces.
Why they’re essential: Understanding fixed costs is crucial for budgeting. Businesses need to cover these costs regardless of their level of activity. Knowing the total fixed costs helps determine the minimum revenue needed to break even.
Variable Costs
Definition: Variable costs change in proportion to the level of production or sales. When production goes up, these costs go up. When production goes down, these costs decrease.
Examples: Raw materials for products, manufacturing supplies, or commission for salespeople. If a company makes more products, it will need more raw materials. Similarly, if sales increase, commission payments might also rise.
Why they’re essential: Grasping variable costs helps businesses understand how additional production or sales will impact expenses. This insight aids in setting product prices and planning for expansion or reduction.
Mixed Costs (or Semi-variable Costs): A Blend of Both
Definition: Mixed costs have characteristics of both fixed and variable costs. They contain a constant, unchanging component and a part that varies with business activity.
Examples: Direct labor costs can be mixed. There may be work that is constant, such as steps to start up and wind down production equipment, and others that change with the level of business activity.
Why they’re essential: These costs can be tricky since they don’t fit neatly into the fixed or variable category. Properly analyzing mixed costs ensures that businesses don’t underestimate or overestimate their expenses.
Step Costs
Definition: a step cost is an expense that remains fixed over a certain range of activity but then jumps to a higher level once that range is exceeded.
Examples: Machinery can handle production up to a certain capacity. If production is increased above its limit, an additional piece of machinery will need to be added. Likewise, Office space can handle a certain headcount. If a company’s staffing level grows beyond its current footprint, it must add new space or relocate to a larger space.
Why they’re essential: Step costs often indicate capacity limits. Understanding where these step increases in costs occur can help businesses budget more effectively, ensuring they are prepared for potential jumps in expenses.
Costs are a fundamental part of business operations. By classifying and understanding them, businesses can make more informed financial decisions. The ability to predict how costs will change under different scenarios is invaluable for budgeting, pricing, and strategic planning. As we continue to explore cost behavior analysis, the relevance and importance of these classifications will become even clearer.
An Important Note on Fixed and Variable Costs
For financial analysis, the important distinction between fixed and variable costs is not whether they change but why they change. Only costs that change due to a change in business activity are considered variable for the purpose of budgeting and decision-making.
While many fixed costs, like rent and software licenses, will stay the same from month to month, others may fluctuate. Utilities and maintenance are two examples. If you are not in an equipment-heavy business, your level of sales or production will have little impact on your utilities or maintenance expenses.
Nevertheless, Utilities will vary from month to month due to changes in utility rates or changes in weather, among other factors. The need for unplanned maintenance can occur at any time due to damage or equipment failure. Some maintenance can also be weather-driven, such as snow removal in certain climates.
While these costs may vary, they are not variable costs as used in expense analysis. So, how should you plan for fluctuating fixed expenses? Since the variations are often unpredictable, some sort of smoothing of the expense is appropriate for budgeting. This may mean using an average of the past twelve months or possibly a seasonal average for expenses that are heavily impacted by weather.
In manufacturing businesses, utilities and maintenance may act like mixed costs. There will be a fixed cost component similar to non-manufacturers. But there will also be higher expenses as activity grows. More electricity will be used to power the equipment, and greater wear and tear will increase maintenance costs.
Fixed Costs that do stay the same from month to month are often tied to an agreement with a specific term, such as a lease or a subscription contract. It is important to stay aware of when contract renewals will occur and to plan for any cost increases that may come with a new agreement.
The Relevance of Cost Behavior Analysis in Business
Having dissected the different types of costs, it’s crucial to appreciate why understanding cost behavior is so pivotal for businesses. When businesses have clarity about how costs act under varying conditions, they can harness this knowledge to their advantage. Let’s explore the major reasons why Cost Behavior Analysis is indispensable in business operations.
Budgeting Precision
Budgeting is a financial roadmap for businesses. Just as a traveler needs an accurate map to reach a destination, a business requires a precise budget to attain its financial goals.
- Fixed Costs give a starting point: A business can set its foundational budget with known fixed costs, ensuring that these basic expenses are accounted for.
- Variable Costs provide scalability: Recognizing variable costs allows a business to adjust its budget based on projected activity levels.
- Mixed Costs introduce flexibility: Businesses can better predict these expenses and allocate funds appropriately by breaking down mixed costs into fixed and variable components.
Enlightened Decision-making
Every business decision, directly or indirectly, has financial implications.
- When contemplating expanding production, understanding Variable Costs aids in determining the additional expenses involved.
- Considering launching a new branch? The Fixed Costs of operating that branch will be a key factor in the decision.
- Thinking about usage-based contracts or services? Insights into Mixed Costs can guide whether this is a cost-effective approach.
Cost Behavior Analysis furnishes business leaders with the data to make decisions grounded in financial realities rather than guesswork.
Profit Analysis and Projections
Profits are the lifeblood of a business. To thrive and grow, businesses must earn more than they spend.
- Fixed and Variable Costs inform a business’s break-even point: the level of sales at which total revenues equal total costs.
- Understanding how costs behave allows businesses to set appropriate pricing strategies. They can determine how changing the price of a product might impact profitability, considering the associated costs.
- Cost Behavior Analysis also aids businesses in making reliable profit forecasts. With clarity on costs, predicting potential profit margins becomes a more exact science.
The Process of Cost Behavior Analysis: A Step-by-Step Breakdown
Cost Behavior Analysis is a structured approach, much like assembling a puzzle. Each piece, or step, is vital to getting a complete and accurate picture. Let’s dive into the systematic process to analyze and understand cost behavior.
- Pinpointing the Relevant Range
The first step is determining the relevant range. This is the spectrum of activity in which a business expects its operations to fall within a given period.
- Importance: Costs might not behave the same way throughout all levels of operations. For instance, renting additional storage space might only be necessary after reaching a specific production level.
- Application: By defining this range, businesses can focus their analysis on realistic scenarios and avoid potential outliers or extreme situations that are less likely to occur.
- Classifying Costs
Once the relevant range is established, the next task is to classify costs as fixed, variable, or mixed.
- Importance: Proper classification ensures that costs are managed, monitored, and predicted correctly. It forms the foundation of any further analysis.
- Application: Review financial statements, contracts, and other related documents. Determine the nature of each expense and categorize it accordingly.
- Dissecting Mixed Costs
Mixed costs can be a bit more complex because they combine elements of both fixed and variable costs. They often need to be separated into their respective components to gain a clearer understanding.
- Importance: Mixed costs can distort analyses if not properly dissected. Accurately identifying the fixed and variable portions allows for more precise budgeting and forecasting.
- Methods: Techniques such as the high-low method or regression analysis are commonly used. For instance, the high-low method involves identifying the highest and lowest levels of activity and the associated costs and then using these points to determine the variable cost per unit and the fixed cost.
- Applying the Data
With the groundwork laid and the analysis complete, businesses can harness this information.
- Importance: The ultimate goal of Cost Behavior Analysis is application. With a robust understanding of costs, businesses can strategize better, optimize operations, and predict financial outcomes more accurately.
- Application: Use the insights from the analysis to shape business strategies. This could mean adjusting pricing models, revising production plans, or re-evaluating service contracts.
Cost Behavior Analysis is not a one-time event but an ongoing process. As businesses grow, adapt, and face new challenges, costs can shift, and their behaviors might evolve. Regularly revisiting and updating the analysis ensures that businesses remain financially informed and agile. Through these systematic steps, businesses can stay ahead of the curve, making proactive decisions based on solid financial understanding.
Breaking Down Variable and Mixed Costs
One of the key aspects of Cost Behavior Analysis is understanding how to break down costs into their essential components. Among these, variable and mixed costs are crucial to grasp, as they often make up a significant portion of a company’s expenses. Let’s delve into how you can determine the formula for these costs.
Variable Costs
Variable costs change directly in proportion to the level of production or activity. When you produce more, you spend more, and when you produce less, you spend less.
How to Determine the Formula for Variable Costs:
- Identify the Cost per Unit: Begin by figuring out how much one unit of activity (like producing one product) costs. This is your variable cost per unit. You can take a forward-looking approach and determine what the per unit cost should be, or you can look back at your history and see what the cost has been. We will dig deeper into historical approaches shortly.
- Formulate: Your variable cost formula will then be:
Variable Cost = Variable Cost per Unit x Number of Units Produced
For example, if it costs $5 to produce one unit, and you produce 100 units, the total variable cost is $5 x 100 = $500.
Mixed Costs
Mixed costs are a combination of fixed and variable costs. They have a constant component but also change as activity levels adjust.
How to Determine the Formula for Mixed Costs:
- Identify the Fixed Component: This is the cost you’d have, even if your activity level was zero. It doesn’t change with production levels.
- Determine the Variable Cost per Unit: Just like with pure variable costs, find out how much one unit of activity costs.
- Formulate: Your mixed cost formula will be:
Mixed Cost = Fixed Cost + (Variable Cost per Unit x Number of Units Produced)
For instance, if your fixed cost is $1000, the variable cost per unit is $5, and you produce 100 units, the mixed cost would be $1000 + ($5 x 100) = $1500.
We will look at three methods for breaking down variable or mixed costs: the High-Low method, using scatter plots, and regression analysis. Using these methods, businesses can accurately classify and predict their costs, which aids in budgeting, pricing, and overall financial planning.
The High-Low Method
Understanding the High-Low Method:
The high-low method is a technique used to separate fixed and variable components of costs in mixed expenses. It considers the highest and lowest levels of activity and the associated costs to determine the variable cost per unit of activity and the fixed cost.
Here’s how it’s applied:
- Identify the highest and lowest levels of activity and their respective costs.
- Calculate the variable cost rate by taking the difference in costs between the high and low activity levels and dividing it by the difference in the levels of activity.
- To determine the fixed cost, subtract the total variable cost (variable cost rate multiplied by the activity level) from the total cost at either the high or low level of activity.
Benefits of the High-Low Method:
- Simplicity: One of the primary advantages is its simplicity. The calculations are straightforward, making it accessible for those not well-versed in more complex statistical methods.
- Quick Insights: With only two data points required, it offers a swift way to estimate fixed and variable costs, helping businesses make timely decisions.
- No Specialized Tools Needed: The high-low method doesn’t rely on specialized software or tools, making it accessible for businesses of all sizes.
Limitations of the High-Low Method:
- Accuracy Concerns: Since it uses only two data points (highest and lowest), it may not always provide the most accurate estimates, especially if those points are outliers.
- Ignores Data Variance: The method doesn’t account for the full range of data. Variations or anomalies in the middle range get overlooked, which might provide a skewed picture.
- Seasonal Fluctuations: If the highest and lowest activity levels are due to seasonal factors, this method may not accurately represent costs for other periods.
- Assumes Linearity: The high-low method assumes that costs increase or decrease linearly. This might not be the case in real-world scenarios where other factors come into play.
The high-low method offers a quick and simple approach to cost analysis, making it a go-to choice for preliminary investigations or for businesses without extensive resources. However, while it serves as a useful starting point, it’s crucial to be aware of its limitations. Combining it with other methods or tools can provide a more comprehensive and accurate view of cost behaviors.
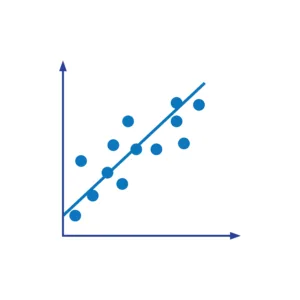
Scatter Plots: Visualizing Variable and Mixed Costs
Scatter plots are simple yet effective graphical tools that can provide immediate visual insights into the behavior of costs. By plotting data points on a chart, businesses can observe trends and patterns, helping them to determine the formula for variable and mixed costs.
What is a Scatter Plot?
A scatter plot is a type of diagram where individual data points are represented as dots on a graph. The horizontal axis (x-axis) often represents the level of activity or production, while the vertical axis (y-axis) represents the total cost.
How to Use Scatter Plots for Variable and Mixed Costs:
- Data Collection: Gather data on your total costs for different activity levels. This might be production quantities, hours worked, or any other measure of activity.
- Plotting Points: Plot a dot on the graph for each data pair (activity level and total cost). Your graph will soon have a collection of points scattered across it. Widely available tools such as Microsoft Excel and Google Sheets can create the graph for you.
- Observing the Pattern: Look at the arrangement of these points:
- If the points form a straight line that starts from the origin (0,0), it indicates variable costs.
- If the points form a straight line but don’t start from the origin, you’re likely dealing with mixed costs.
- Drawing the Line of Best Fit: Draw a straight line that seems to fit the data points best. Software programs can automatically add the trend line to their graphs. If you create a scatter plot manually, you can draw a line using a ruler or a similar tool. This line helps in understanding the general trend of the costs.
- Interpreting the Plot:
- The place where the line intersects the y-axis represents the fixed cost (for mixed costs).
- The steepness or slope of the line indicates the variable cost rate. A steeper line means higher variable costs.
Advantages of Scatter Plots:
- Visual Clarity: Scatter plots provide a clear visual representation of data, making it easier to see patterns and relationships.
- Immediate Insights: Even without advanced analysis, just a glance at a scatter plot can give businesses a sense of how their costs are behaving.
- Foundation for Further Analysis: Scatter plots can be a starting point for more advanced methods like regression analysis.
Points to Consider:
- Outliers: Sometimes, a scatter plot might have data points that don’t seem to fit the general pattern. These outliers can skew the line of best fit and should be considered carefully.
- Limited Detail: Scatter plots provide an overview but may not capture all nuances of cost behavior, especially when multiple factors influence costs.
Scatter plots are valuable visual tools in Cost Behavior Analysis. They allow businesses to quickly grasp the nature of their costs and set the stage for deeper, more detailed analysis. By effectively utilizing scatter plots, businesses can make more informed decisions and better anticipate future costs.
Regression Analysis: An Advanced Tool for Determining Variable and Mixed Costs
Regression analysis is a powerful statistical tool that businesses use to understand relationships between variables. In the context of Cost Behavior Analysis, regression can help determine the formula for variable and mixed costs by analyzing how costs change with different activity levels. Software can simplify the regression calculations, but you must be able to interpret the results correctly.
What is Regression Analysis?
At its core, regression analysis helps to determine the strength and character of the relationship between one dependent variable (like total cost) and one or more independent variables (like the number of units produced).
Using Regression Analysis for Variable and Mixed Costs:
- Gathering Data: The first step is collecting data on your costs and the associated activity levels. For example, you might record the total cost incurred at different production levels over several months.
- Plotting Data: Using a scatter plot, you can visualize the relationship between your activity level (x-axis) and total cost (y-axis). Each point on the scatter plot represents a specific activity level and its associated cost. Creating a scatter plot is not required to perform a regression analysis and is not practical if there are more variables, but it can help to visualize the data and identify any outlier data that should be addressed.
- Fitting the Best Line: Regression analysis finds the formula for the best-fitting line (often called the “line of best fit”) that goes through the data points. This line represents the relationship between your costs and activity levels.
- Interpreting the Line: The slope of this line gives the variable cost per unit. It shows how much the total cost increases for a one-unit increase in activity. The point where the line intersects the y-axis (even when the activity level is zero) gives the fixed cost component, which remains consistent regardless of the activity level.
Benefits of Using Regression Analysis:
- Accuracy: Regression provides a more accurate estimate of variable and fixed costs than other methods, especially when costs don’t change strictly linearly.
- Predictive Power: Once you have the regression equation, you can predict future costs at different activity levels, aiding in budgeting and planning.
- Handling Multiple Factors: Advanced regression techniques can consider multiple independent variables. This is useful if, for instance, costs depend on both the number of units produced and another factor like advertising spend.
Potential Challenges:
- Data Quality: Regression analysis is only as good as the data you feed into it. Inaccurate or incomplete data can lead to misleading results.
- Overfitting: If there are too many variables and not enough data points, the regression model might become too complex, capturing random noise rather than genuine patterns.
- Assumptions: Regression makes certain assumptions about the nature of the relationship between variables. If these aren’t met, the analysis may not be valid.
Regression analysis is a versatile and valuable tool in the realm of Cost Behavior Analysis. By leveraging this method, businesses can gain deeper insights into their cost structures, make more informed decisions, and better predict future financial scenarios. As with any tool, it’s essential to use regression analysis correctly and understand its limitations.
What is the Run Rate, and when to use it?
Even if you have a long history of financial data, sometimes your past doesn’t reflect your future. You might need to look at your run rate for help when this happens. The run rate is a method used to forecast revenue and expenses based on current financial performance, typically over a shorter period, such as a month or a quarter. In simple terms, it’s extrapolating current performance to predict full-year results. Your run rate may be useful in budgeting fixed costs or the per unit cost of variable expenses.
When to Use the Run Rate in Budgeting:
- New Businesses: For startups or companies without a full year of financial history, the run rate can offer a glimpse into potential annual performance, aiding in budgeting and planning.
- Post Major Changes: If a company launches a new product, enters a new market, or undergoes any other significant change, the run rate post-change can help gauge the annual impact of that change.
Points of Caution:
While the run rate is undoubtedly useful, it’s crucial to use it judiciously:
- Seasonal Variations: Some businesses experience seasonal fluctuations in sales. Using the run rate from a peak season could result in overestimated projections for the entire year.
- One-time Events: If earnings for a specific period are influenced by a one-off event (like a large sale or an unexpected expense), the run rate could provide a skewed forecast.
- Constant Change: In fast-evolving industries or markets, conditions can change rapidly. Relying solely on a run rate can lead to outdated or irrelevant projections.
Challenges and Limitations of Cost Behavior Analysis
While Cost Behavior Analysis provides invaluable insights for businesses, like any tool or method, it is not without its challenges and limitations. Recognizing these potential hurdles allows businesses to use the analysis more effectively and be aware of areas where additional scrutiny might be needed.
Static vs. Dynamic Environments
Cost Behavior Analysis often relies on historical data to predict future costs. However, the business landscape is continually evolving.
- Challenge: If a business environment undergoes significant changes, past cost behaviors might not accurately predict future ones.
- Solution: Continuously update data and remain alert to external factors like technological advancements, regulatory changes, or shifts in market demands, which can affect cost structures.
Difficulty in Classifying Costs
Not all costs fit neatly into fixed, variable, mixed, or step categories. Some expenses might seem to behave differently based on various factors.
- Challenge: Misclassification of costs can lead to inaccurate predictions and misguided decision-making.
- Solution: Regularly review and re-evaluate cost classifications. As business processes or external factors change, the behavior of certain costs may change as well.
Assumption-based Limitations
Certain methods, like the high-low method for dissecting mixed costs, are based on specific assumptions. These assumptions might not always hold true.
- Challenge: Relying solely on assumption-based methods can sometimes oversimplify complex cost behaviors or miss out on nuances.
- Solution: Use a combination of methods and always validate assumptions against real-world data and observations.
Over-reliance on Quantitative Data
Cost Behavior Analysis is primarily a quantitative tool, focusing on numbers and patterns. However, businesses also operate in qualitative realms.
- Challenge: Solely relying on numerical data might overlook qualitative factors like employee morale, brand reputation, or customer loyalty, which can indirectly influence costs.
- Solution: Complement Cost Behavior Analysis with qualitative evaluations. Understand that while numbers provide clarity, the complete picture often requires a mix of quantitative and qualitative insights.
The Trap of Oversimplification
There’s a temptation to simplify complex scenarios for easier analysis. However, oversimplification can lead to key factors being overlooked.
- Challenge: By not accounting for all potential variables, businesses might end up with a skewed understanding of cost behavior.
- Solution: Ensure a holistic approach to analysis. While simplification can make data more digestible, it’s vital to strike a balance between clarity and comprehensiveness.
Awareness is the first step to overcoming challenges. By understanding the limitations of Cost Behavior Analysis, businesses can approach the tool with a critical mind, ensuring that insights are both accurate and actionable. While the method is powerful, it is most effective when used in conjunction with other tools, evaluations, and a keen understanding of the ever-changing business landscape.
Practical Tips for Effective Cost Behavior Analysis
For businesses eager to harness the power of Cost Behavior Analysis, knowing the theory is just half the battle. Implementing this knowledge effectively requires a blend of precision, adaptability, and foresight. Here are some practical tips to ensure that your Cost Behavior Analysis is both efficient and insightful.
- Regularly Update Your Data
The foundation of any analysis is the data behind it. In an ever-changing business world, stale data can lead to inaccurate predictions.
- Tip: Establish a routine where financial data is updated and reviewed regularly. This ensures that your analyses are based on the latest information, making them more reliable.
- Use Technology to Your Advantage
In the age of digital transformation, various tools and software can assist in Cost Behavior Analysis.
- Tip: Invest in financial analytics software that can help automate parts of the analysis, provide visual representations of cost behaviors, and highlight patterns that might be missed in a manual review.
- Seek Expertise When Needed
Even with the best tools and intentions, some aspects of Cost Behavior Analysis might be complex and challenging.
- Tip: Don’t hesitate to consult with financial experts or analysts when faced with challenging scenarios. Their experience and perspective can provide valuable insights and clarity.
- Collaborate Across Departments
Costs are not just numbers on a financial statement but the outcome of various departmental activities and decisions.
- Tip: Engage with different departments when conducting Cost Behavior Analysis. Their firsthand knowledge of operations can provide context to the numbers, leading to more accurate classifications and predictions.
- Educate and Train Your Team
A well-informed team can contribute more effectively to the analysis process.
- Tip: Regularly conduct training sessions on the basics of Cost Behavior Analysis. Ensuring that relevant team members understand the concepts can facilitate better data collection, reporting, and interpretation.
- Be Cautious of Outliers
Occasionally, certain data points might drastically deviate from the norm. These outliers can skew analysis results if not accounted for.
- Tip: Identify and examine outliers carefully. Understand their causes and decide whether they should be included in the analysis or treated as special cases.
- Integrate Qualitative Insights
As mentioned earlier, numbers only tell part of the story.
- Tip: Regularly gather qualitative feedback from departments, customer surveys, or market analyses. This can provide context to your quantitative data, offering a richer understanding of cost behaviors.
Cost Behavior Analysis is a dynamic process, and its effectiveness is heightened when businesses approach it with a blend of methodical precision and adaptability. By integrating these practical tips, businesses can ensure that their analysis is not just theoretically sound but also practically impactful, leading to better financial strategies and decisions.